
Monday was the fifth anniversary of the day the Census Bureau estimated the U.S. population reached 300 million.
As that day marked the third time the country’s population has reached a 100 million-people milestone, I believe it is important to think about the path the country has traveled and to consider the implications of where we are headed.
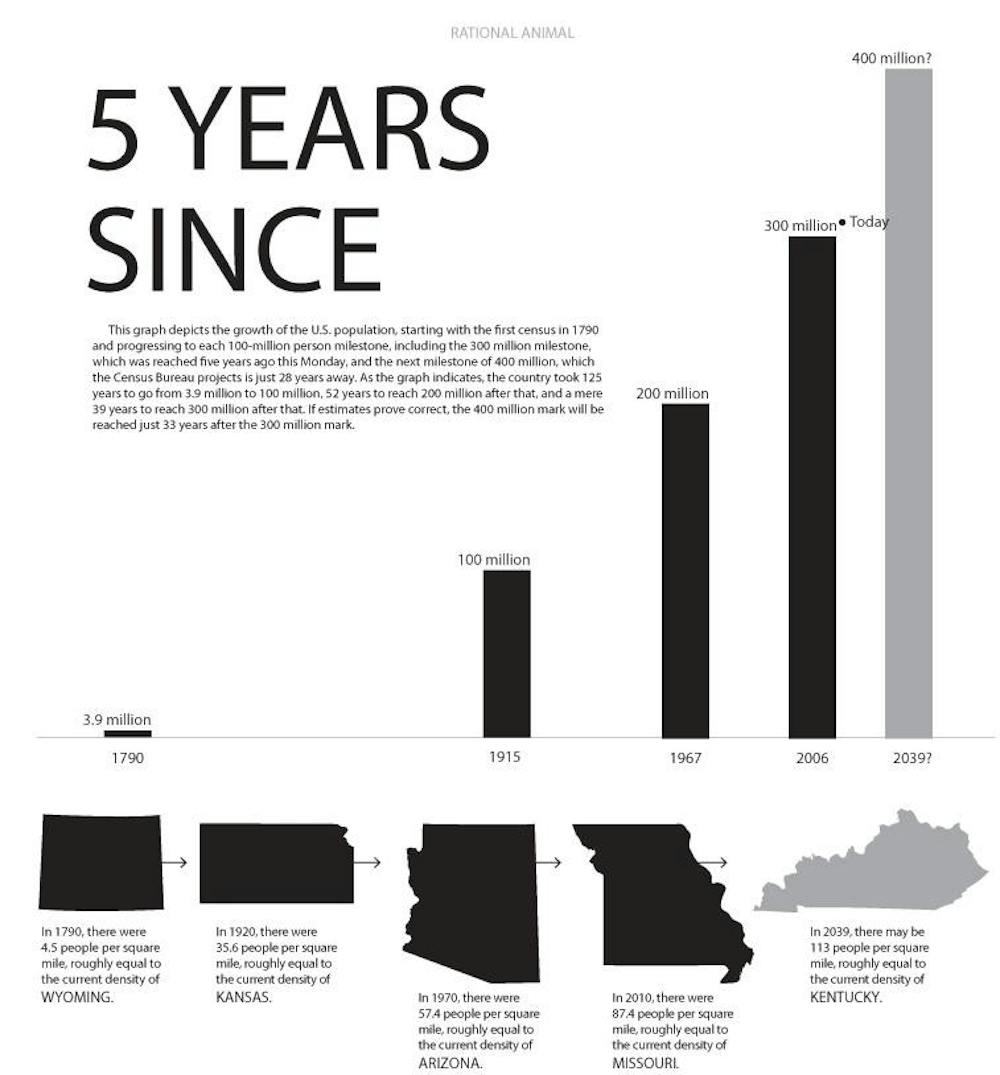
First, let’s get some historical perspective.In 1790, the first census recorded a national population of about 3.9 million and a population density of 4.5 people per square mile , which is comparable to Wyoming’s current density. By 1915, the country’s population had reached 100 million, a roughly 25-fold increase in a span of 125 years. At the time of the 1920 census, the population density was 35.6 people per square mile, which is close to Kansas’ current density.
The 200 million mark came in 1967, just 52 years after the U.S. hit 100 million. The 1970 census found that the population density had reached 57.4 people per square mile, roughly equal to Arizona’s current density.
When we hit 300 million, it had been a mere 39 years since we surpassed 200 million.
Last year’s census showed a population density of 87.4 people per square mile, making Missouri an average state in terms of density.
All of this may seem to indicate serious overpopulation problems.
After all, the above figures mean the country’s population is more than 75 times greater than it was in 1790 and that, even though the country’s land area has increased roughly four-fold, the U.S. now has about 19 times more people per square mile than it did back then.
Fortunately, there are many reasons not to be alarmed. Here are just two: First, a density of 87 people per square mile is still remarkably low, both by world standards and in terms of available space in this country.
As I noted in a previous column, the world’s average population density is 122 people per square mile. Many countries are considerably more dense than that. Looking at density in terms of available space in this country can also be instructive.
The 2010 census found an average household size of 2.6 people, meaning there are about 120 million households in the country. If every household were given an acre of land, the entire population would require just 187,500 square miles, which is about 5 percent of the nation’s land area and is less than the combined area of Colorado and Wyoming.
Second, Americans’ quality of life has increased immeasurably while our population has grown, which is no coincidence. As 19th-century Europeans sought refuge from oppressive conditions by coming to America, the population grew. The influx of immigrants spurred industrial and technological progress as manpower and brainpower joined forces in the great cities of what is now called the Rust Belt. The rising prosperity that resulted attracted more immigrants while continuing to inspire the U.S.-born population to have children, and the cycle continued.
Looking ahead to the 400 million mark, which the Census Bureau believes we will hit in 2039, what can we expect?
We know the population density will be about 113 people per square mile, which is a bit more than Kentucky’s current density. We can probably expect the share of the population that is 65 and older to continue growing, which will strain systems such as Social Security.
Higher immigration and birth rates, fortunately, can help cushion that blow in this country, whereas Japan and many European countries will be facing an even steeper climb due to shrinking populations and low birth rates.
Some worry that while overall density will still be fairly low, we will see excessive crowding in coastal areas, such as Southern California, Florida and the Northeast.
While there will still be population growth in those areas, we can take comfort in the fact that much of the growth will be in states that aren’t on the coasts .
In the last decade, the five fastest-growing states were Nevada (35.1 percent), Arizona (24.6 percent), Utah (23.8 percent), Idaho (21.1 percent) and Texas (20.6 percent) .
California, by contrast, barely beat the national average of 9.7 percent with its 10 percent growth. New York and New Jersey grew by just 2.1 and 4.5 percent, respectively.
Despite some Americans’ concerns, it looks like the 400 million-person America of 2039 will be prosperous, relatively uncrowded and better positioned than many industrialized nations to tackle the challenge of an aging society.
Today, the U.S. population is about 312.5 million. To the next 88 million, I say, “Come on in! There’s plenty of room.”
— jarlower@indiana.edu
2039, here we come
Get stories like this in your inbox
Subscribe


