
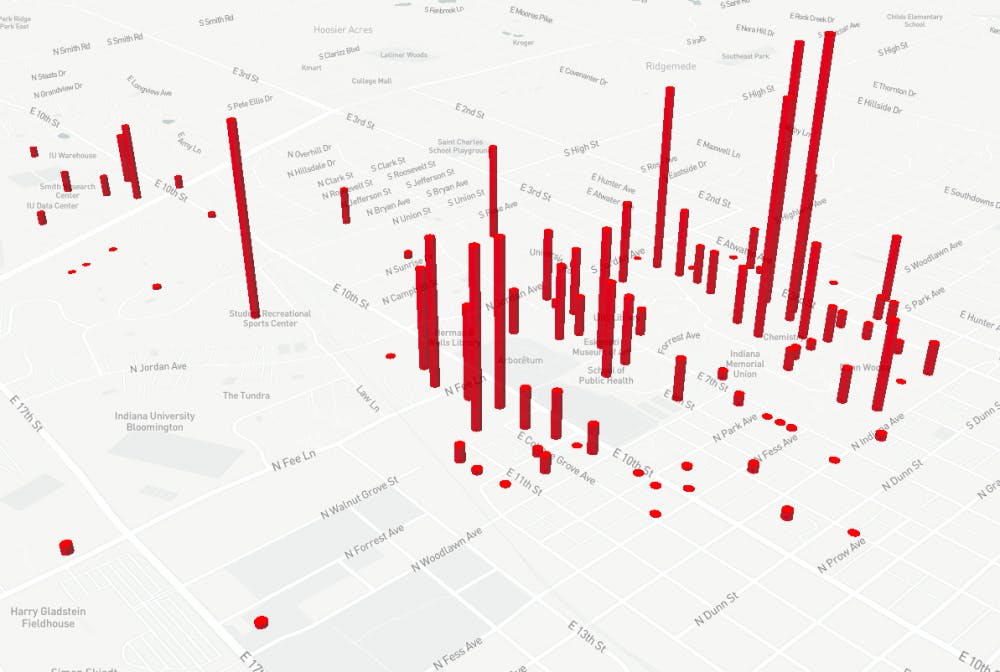
There are 618,000 cubic feet of utility tunnels snaking under the ground IU students tread, transporting utilities to residential and academic buildings. The Indiana Daily Student analyzed data to understand how these utilities are used among buildings on campus.
Use the map below to compare building usages by utility and read on for some key findings. Rotate the map by holding down the right mouse button or by using control/command + left click.
To perform this analysis, reporters downloaded and visualized data from a public records request for utility usage in academic buildings from June 2017 through July 2018. Residential buildings were not included in the dataset, and some academic building utilities were not included by IU because not every utility is sub-metered at every building at IU.
The top three electricity consumers on campus were all science buildings.
Like a vast majority of IU students living off campus, IU also sources its electricity from Duke Energy. IU uses 280 million kilowatt hours of power annually. To put that in perspective, the average US residential consumer used 10,399 kilowatt hours in 2017 — almost as much electricity as the Kirkwood Observatory used from July 2017 to July 2018.
Mark Menefee, assistant director of IU Utility Services, said science buildings consume more electricity for a few different reasons.
A national building code says that at least 20% of air in circulation in any building must come from outside to provide fresh air. However, in buildings where experiments take place, like Jordan Hall, this number can be as high as 100%. As a result, these buildings must expend more energy heating and cooling outside air.
These building also have hoods, so chemicals can be safely mixed. These hoods’ powerful exhaust fans use electricity to remove dangerous chemicals and vapor to protect researchers.
IDS uncovers unusual water use at McKinney Fountain.
The highest water consumer in the dataset was the McKinney Fountain, which used more than 12 million gallons of water in a year. Andrea Moore, a utilities data analyst, said this number was taken from the meter's register readings.
IU Utility Services began investigating the fountain's water usage after the IDS brought up the number. Read more here.
Heating through steam sees spike in summer.
Heating at IU is done through steam and natural gas. Menefee said 75% of all buildings are heated through steam. Generally older buildings that are not connected to the steam grid use natural gas as an energy source.
As one might expect, steam spikes in the winter when buildings need to be heated. However, almost all buildings that are heated through steam also saw a spike in the month of August. This might seem counterintuitive because air conditioning is on during August, not heating.
Menefee said this spike is because these buildings draw in outside air to cool, but this air is cooled to around 55 degrees Fahrenheit. In order to bring that air to a more comfortable room temperature, it needs to be reheated. He also attributed this increase to the influx of students coming back to campus.
IU is reducing its carbon footprint by switching to natural gas.
IU’s Central Heating Plant generates heating for around 75% of campus buildings. It does this by using natural gas to heat water to steam, then distributing that steam to heating units in buildings across campus.
Menefee said heating buildings is around 30% of IU’s overall carbon footprint, but heating used to be a much larger part of campus's carbon emissions.
In 2012, IU switched from using coal for heating to using natural gas. Now, the Central Heating Plant uses 95% natural gas and 5% coal — a reduction that saw emissions fall by 43% from 2011 to 2012.
About this story: Data was sourced from a public records request. Utilities consumption was then visualized and rescaled in the graphic for better visibility. Any missing utilities for any academic buildings are because those utilities are not currently being tracked. Special thanks to Daniel J. Story and Jack Gilson for their support in creating this project.


